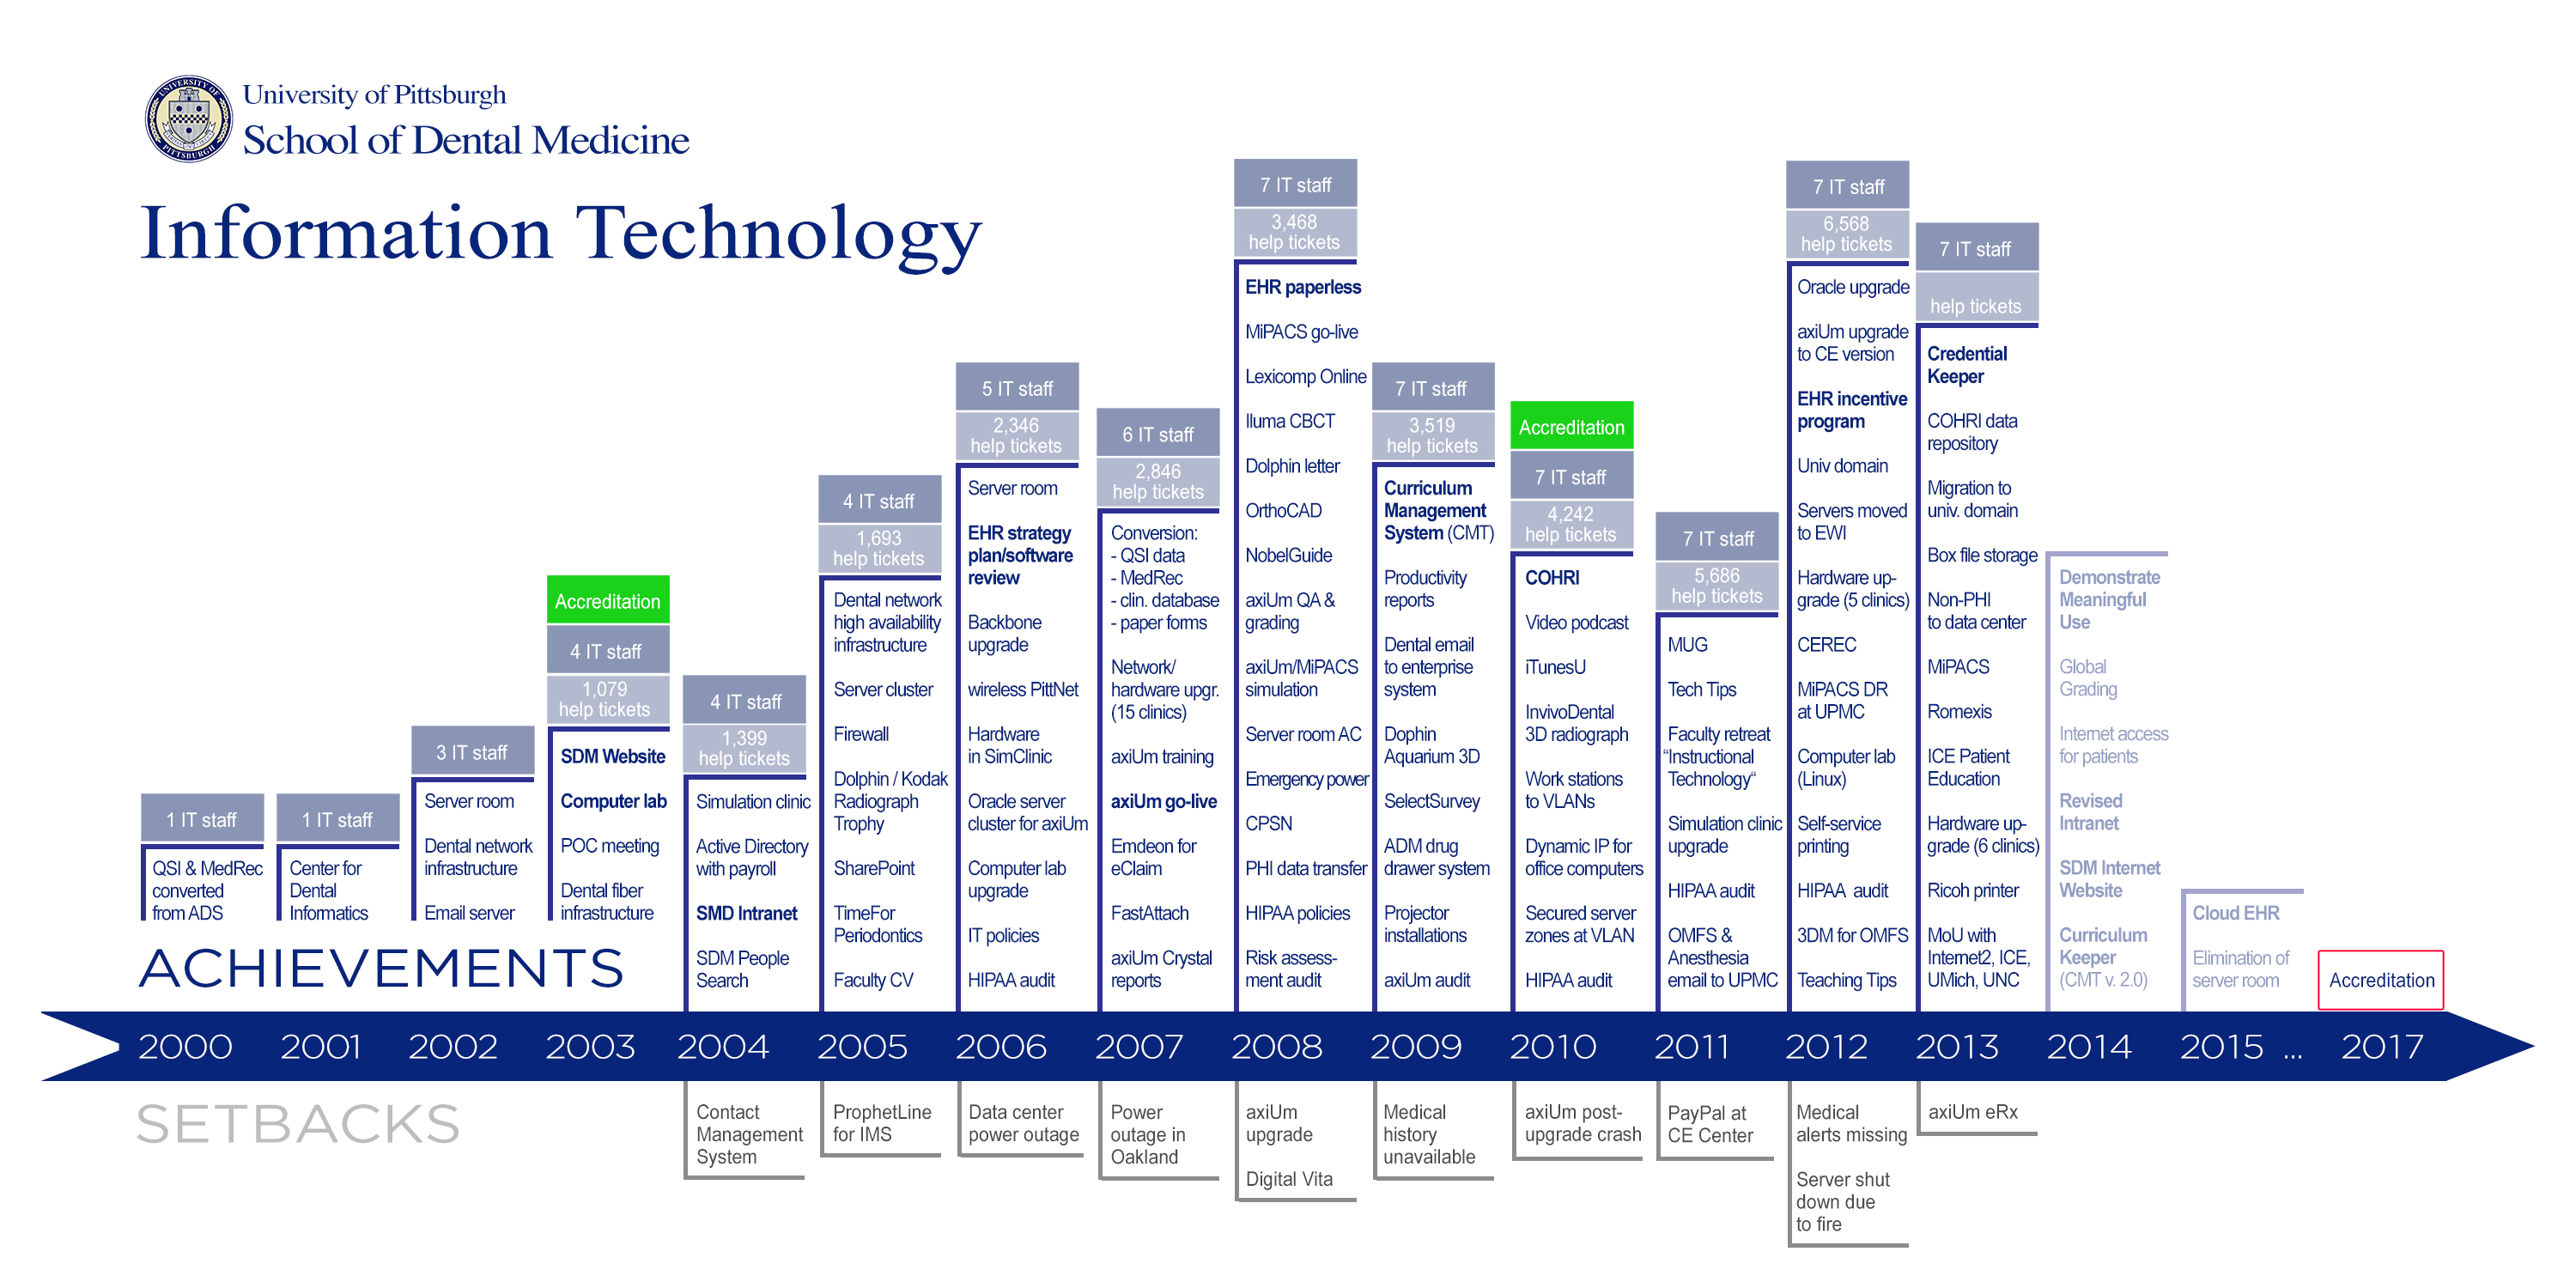
Recent history is usually boring and nobody wants to read long reports or complicated lists of events. Intrigued by an idea from Dr. Lynn Johnson, I have recently created a timeline graphic with my wife, Gisela, showcasing the last decade of accomplishments and setbacks in the information technology arena at the University of Pittsburgh School of Dental Medicine. The challenge was to keep the text short, but make it comprehensive enough so that non-experts can understand it (Figure 1).
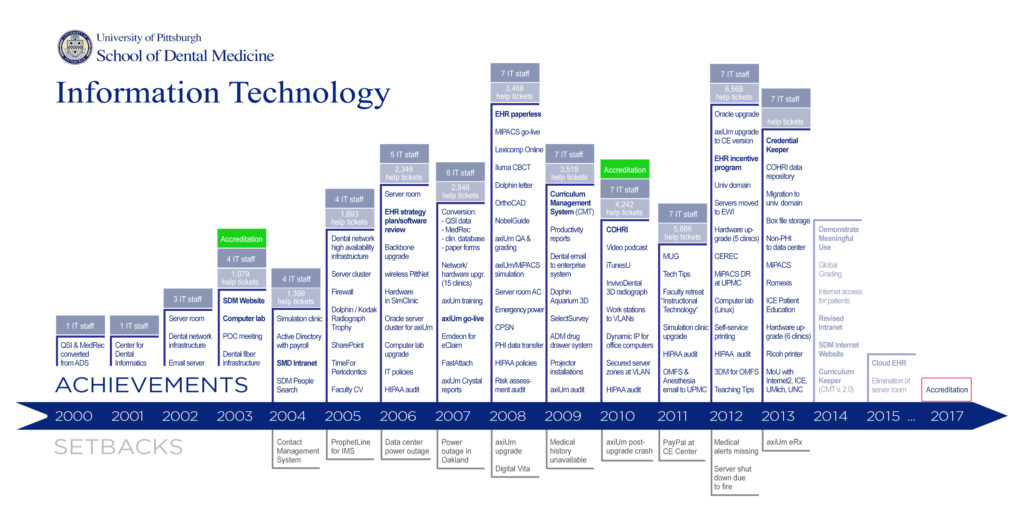
Figure 1: SDM Information Technology Timeline 2013 (click in the picture for a larger version).
