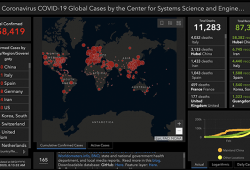
Coronavirus COVID-19 Global CasesVisualised by the Center for Systems Science and Engineering (CSSE) at Johns Hopkins University (JHU): Click here for live...
I will travel to Birmingham, UK during the next week to present at the British Association of Oral Surgeons Study Day a series of seminars devoted to...
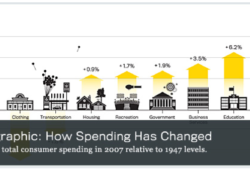
I am increasingly interested in infographics to tell stories. Steven Rose published a recent article in The Atlantic about where our money goes compared with...
The technology section of the New York Times shows a video titled “Nicholas Felton: A Quantified Life” describing Nicholas Felton’s obsession with data....
When doing anything online, we increasingly experience that video seems to be the new Web. This trend is not only expressed in the rise of YouTube popularity...
I am currently, together with more than 2,000 people, enrolled in a MOOC “Introduction to Infographics and Data Visualization.” This course is directed by...
BusinessWeek reports that President Obama has Edward Tufte appointed to help visualizing where the economic stimulus money is going. The article celebrates...
Published on March 5th in the NYT: “For the last three years, Gallup has called 1,000 randomly selected American adults each day and asked them about...
Nature published a special package titled “Looking at the Best Cities for Science” by Richard Van Noorden showcasing interactive graphics. The analysis...
On March 16, 2009, Katrina Kelner, editor of Science Translational Medicine, Managing Editor, Research Journals, Science Magazine gave a talk at NIH which was...