During the last few days, I was revising a scientific poster which included the description of a complex workflow. The challenge was to “translate” a detailed textual description into a visually appealing layout without losing too much detail. The poster was done in MS-PowerPoint and the graphic was developed in Adobe Photoshop Extended CS5. I went through several iterations with the help of the first author, Dr. Tanja Bekhuis, Quantitative Psychologist, Writer and Information Specialist who works as postdoctoral scholar at the University of Pittsburgh, Department of Biomedical Informatics. Please see Figure 1, the original poster with textual representation of the workflow. Figure 2 shows the revised poster and Figure 3 allows you to see the workflow graphic in detail. The poster was presented at the AMIA Annual Symposium 2010 in Washington DC.
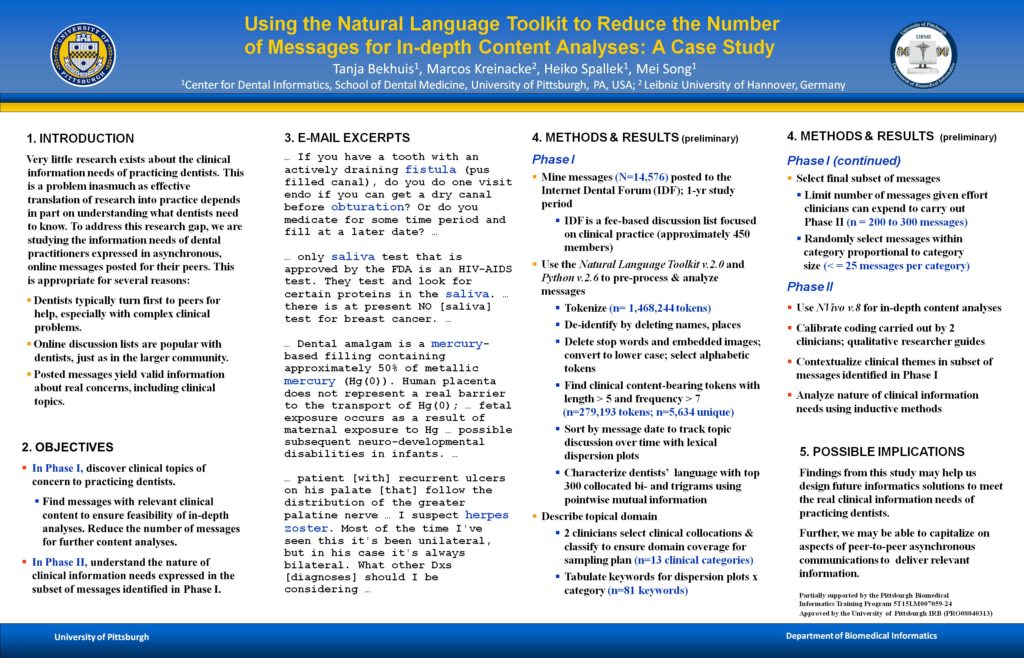
Figure 1: Original Version
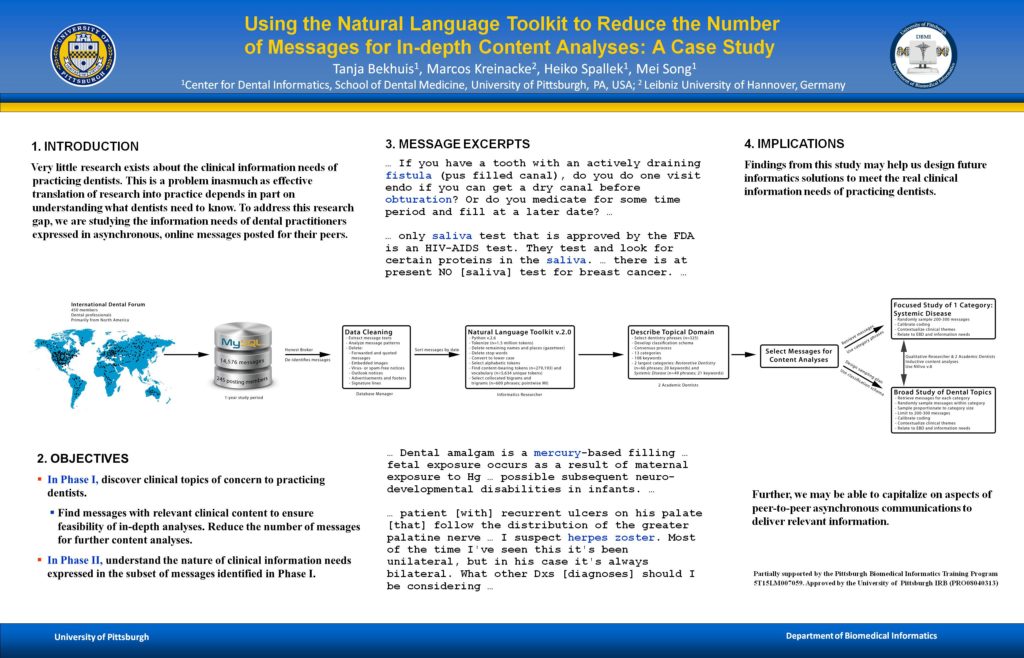
Figure 2: Final Version
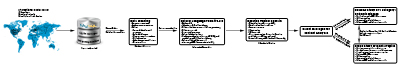
Figure 3: Workflow graphic (click on thumbnail to see full-size version)
Full title and authors: Using the Natural Language Toolkit to Reduce the Number of Messages for In-depth Content Analyses: A Case Study Tanja Bekhuis(1), Marcos Kreinacke(2), Heiko Spallek(1), Mei Song(1); 1:Center for Dental Informatics, School of Dental Medicine, University of Pittsburgh, PA, USA; 2: Leibniz University of Hannover, Germany
